
We had a horrendous wind storm hit northeastern Oklahoma at about midnight last Saturday. Straight winds of 100 mph were recorded and our family, and the dog and cat, were in our “safe space” for not very long.
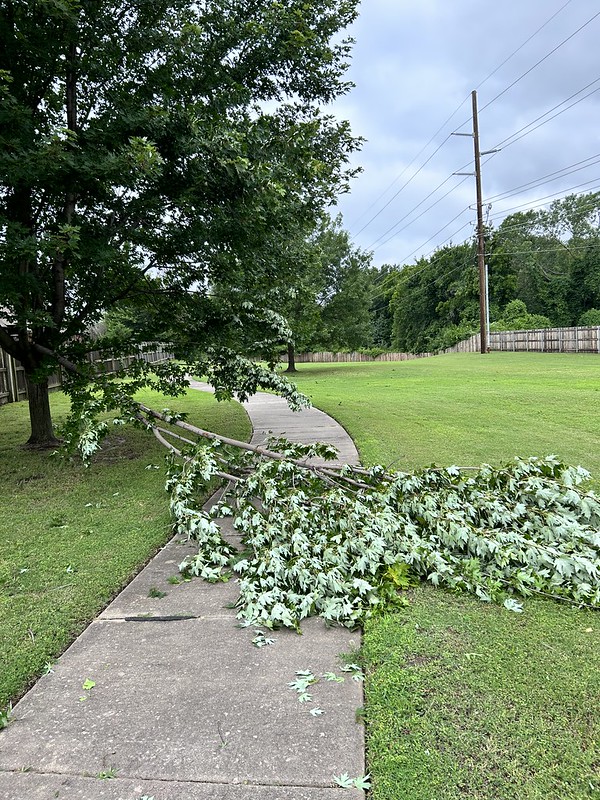
We didn’t suffer any damage at all although we are getting our roof inspected and might have some tree work to do. Our neighborhood didn’t have much damage either except for trees down. All I can say is thank goodness for underground utilities.

Elsewhere in Tulsa it was a different story. Over 200,000 people lost power. By now over half those have it back and it has been a great response from other states sending their utility crews here to help get power restored. They think that they will have everybody hooked back up by late Saturday afternoon.
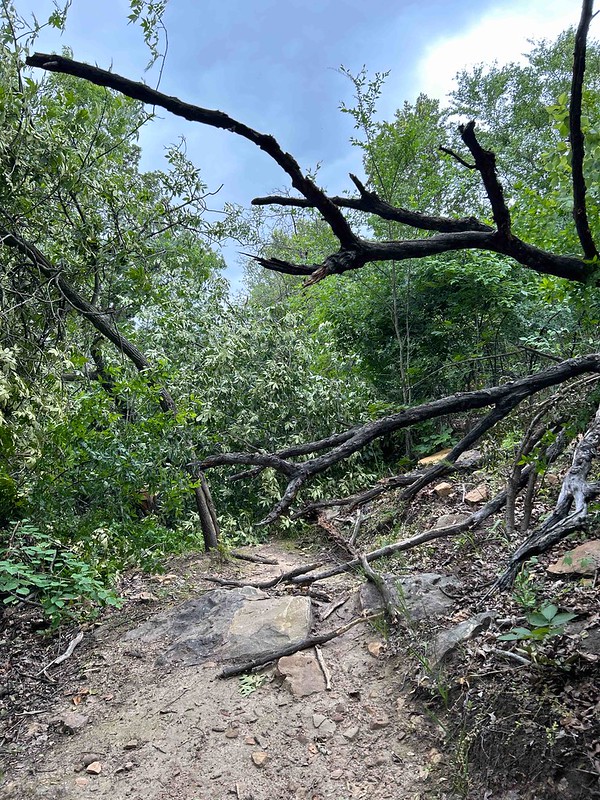
Turkey Mountain had a lot of damage. Volunteers got out there with their chain saws and got a lot of the trails cleared. I don’t do chainsaws but I moved some limbs off the trails as I found them.

There are still some “hangers” or “leaners” that will have to be removed by people that know what they are doing. Best to keep an eye up in the air to avoid hazards.

The sounds of chainsaws were all over the place when I made my outing the other day.

Reportedly by now almost all the main trails are open.
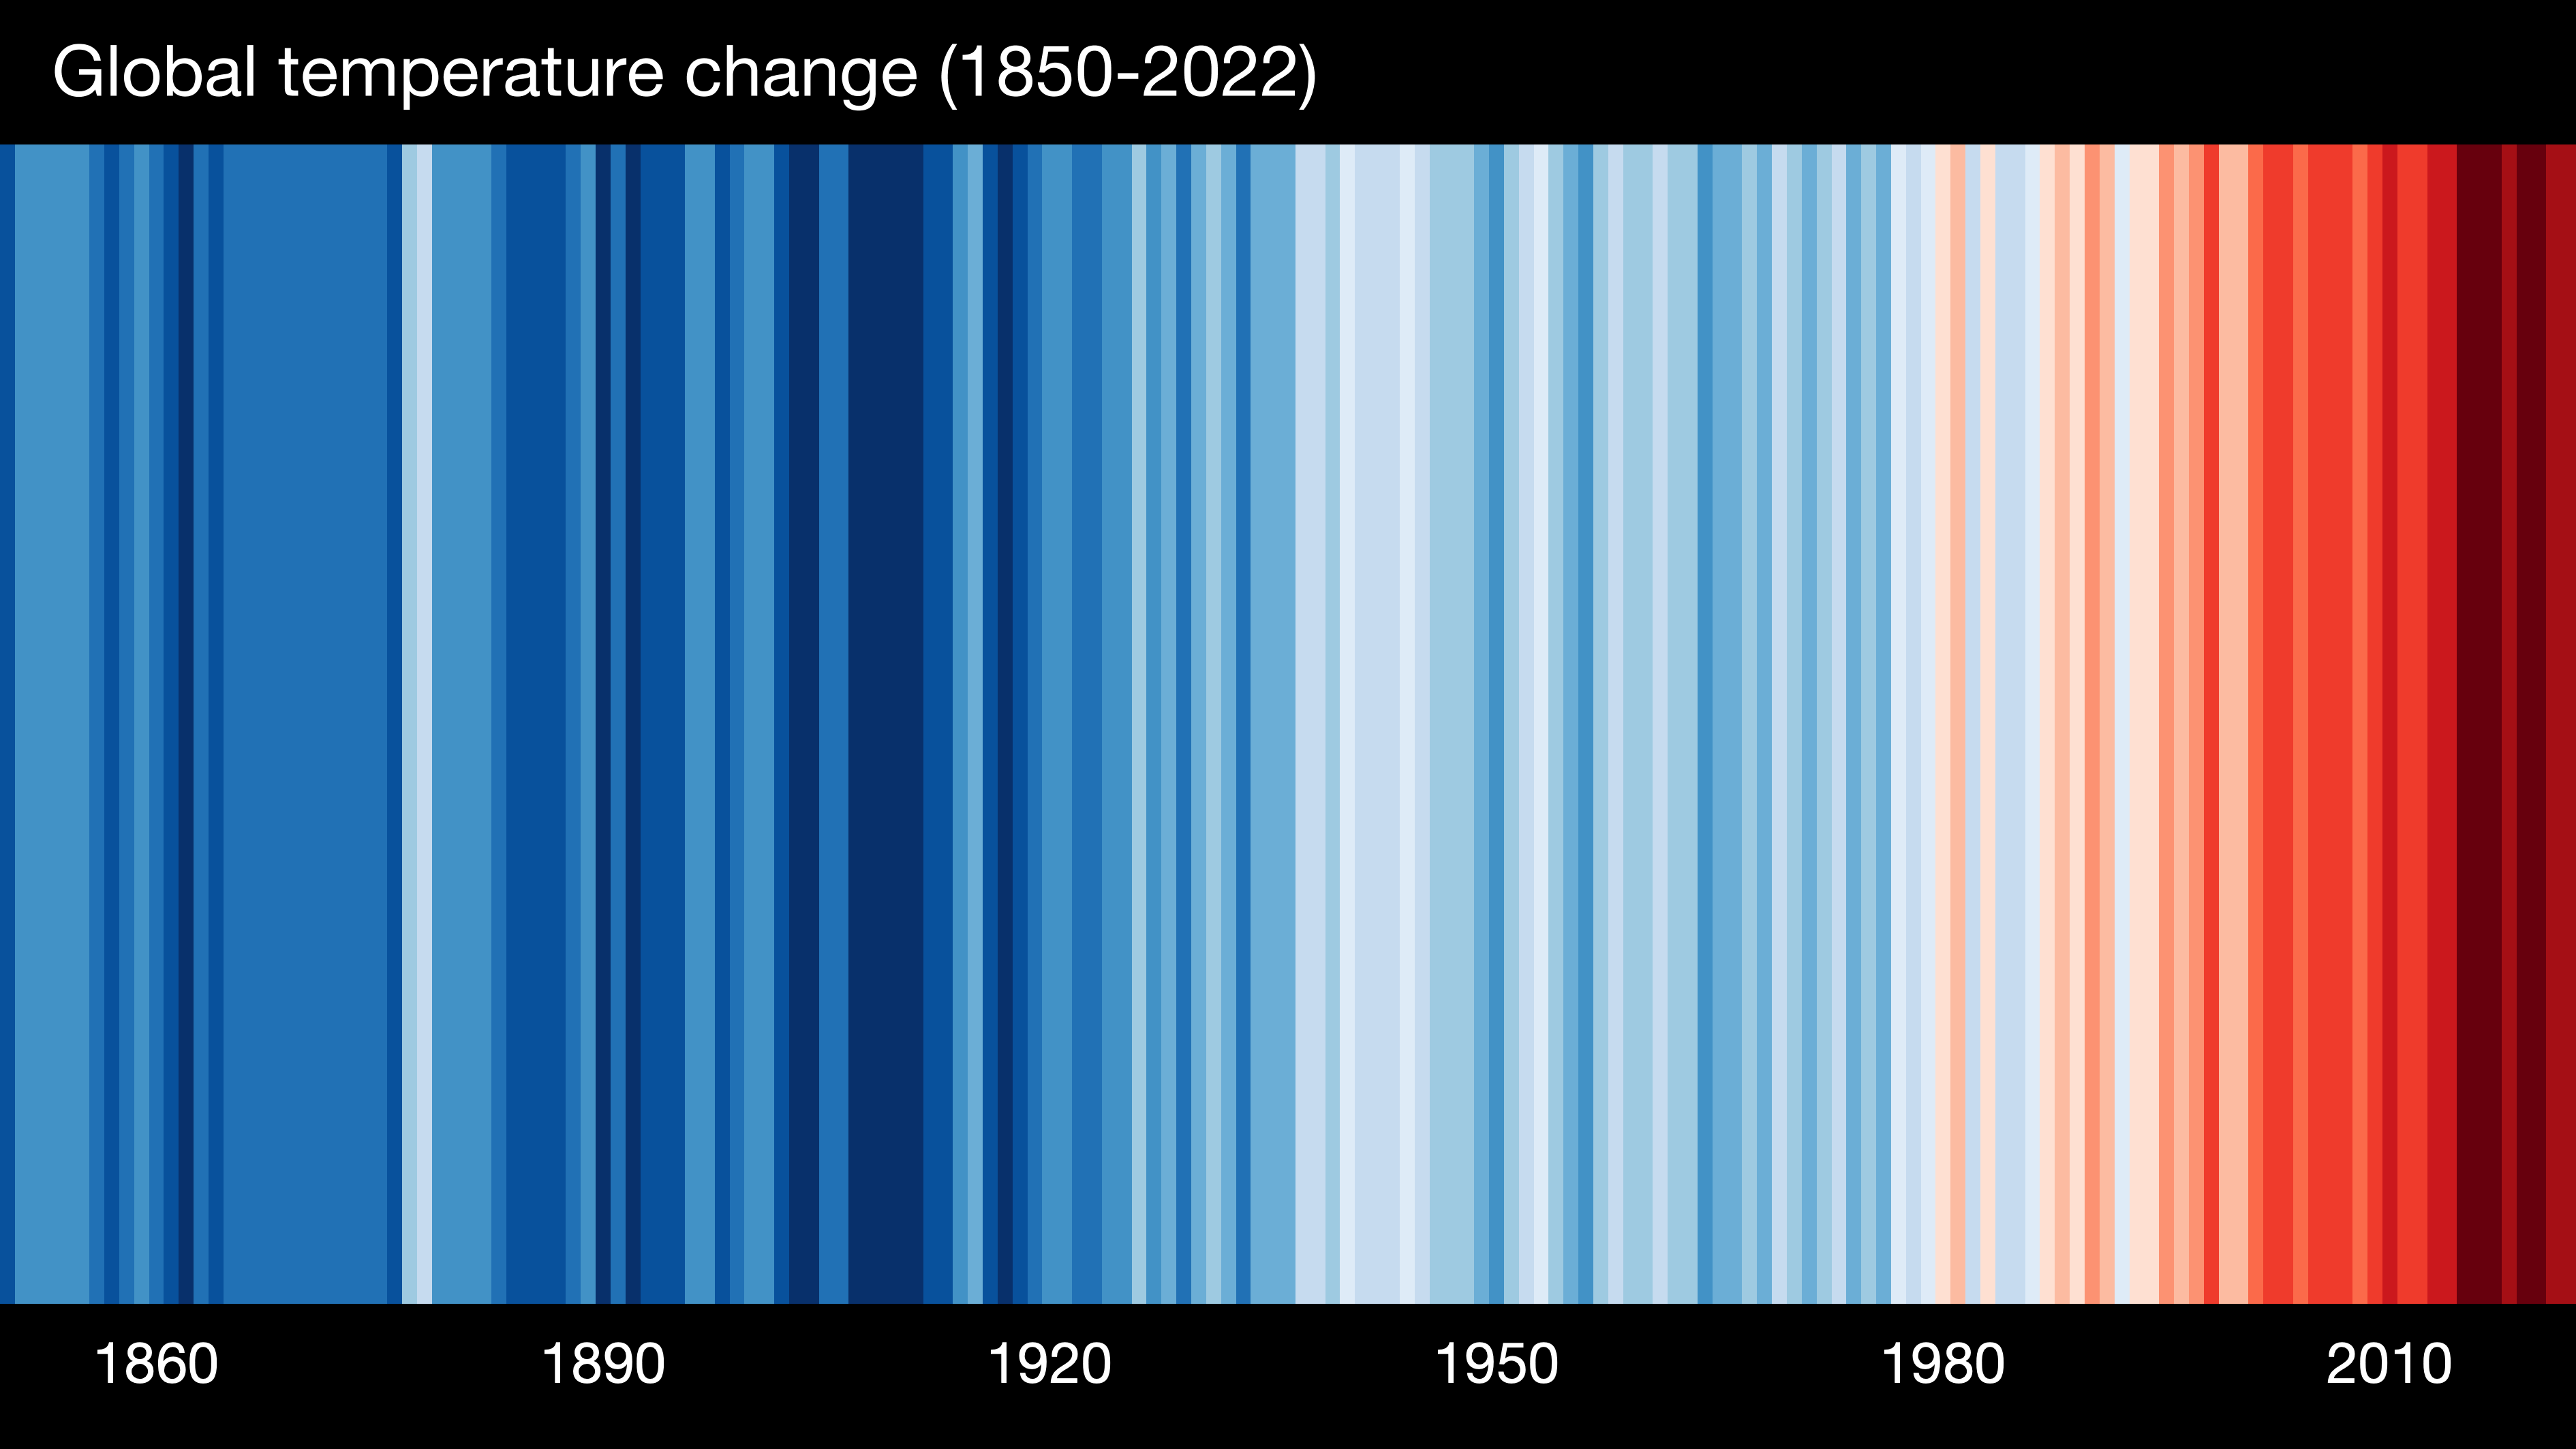
Of course it is difficult to pin any particular weather event on global warming but still one wonders. Something new I’ve seen in the last few days is “#ShowYourStripes” a graphic developed by Ed Hawkins at the University of Reading in England. It’s like a bar code showing the yearly variation of temperature from the long term average over a time period.
The global temperature change chart is as follows. Blue means below the long term average and orange is above. The darker the color, the more difference there is. So this is the Global stripes showing data from 1850 and one can definitely see that things are warming up quickly. Keep in mind it is just temperature data and doesn’t say anything why.
So, I jumped in and looked at the Oklahoma data which they have from 1895 and the results surprised me. Oklahoma has had ups and downs over the whole time period. Although there is a definite trend since the year 2000. But there was a previous period back in 1930 or so that had increasing temperatursewhich roughly coincides with the dustbowl.
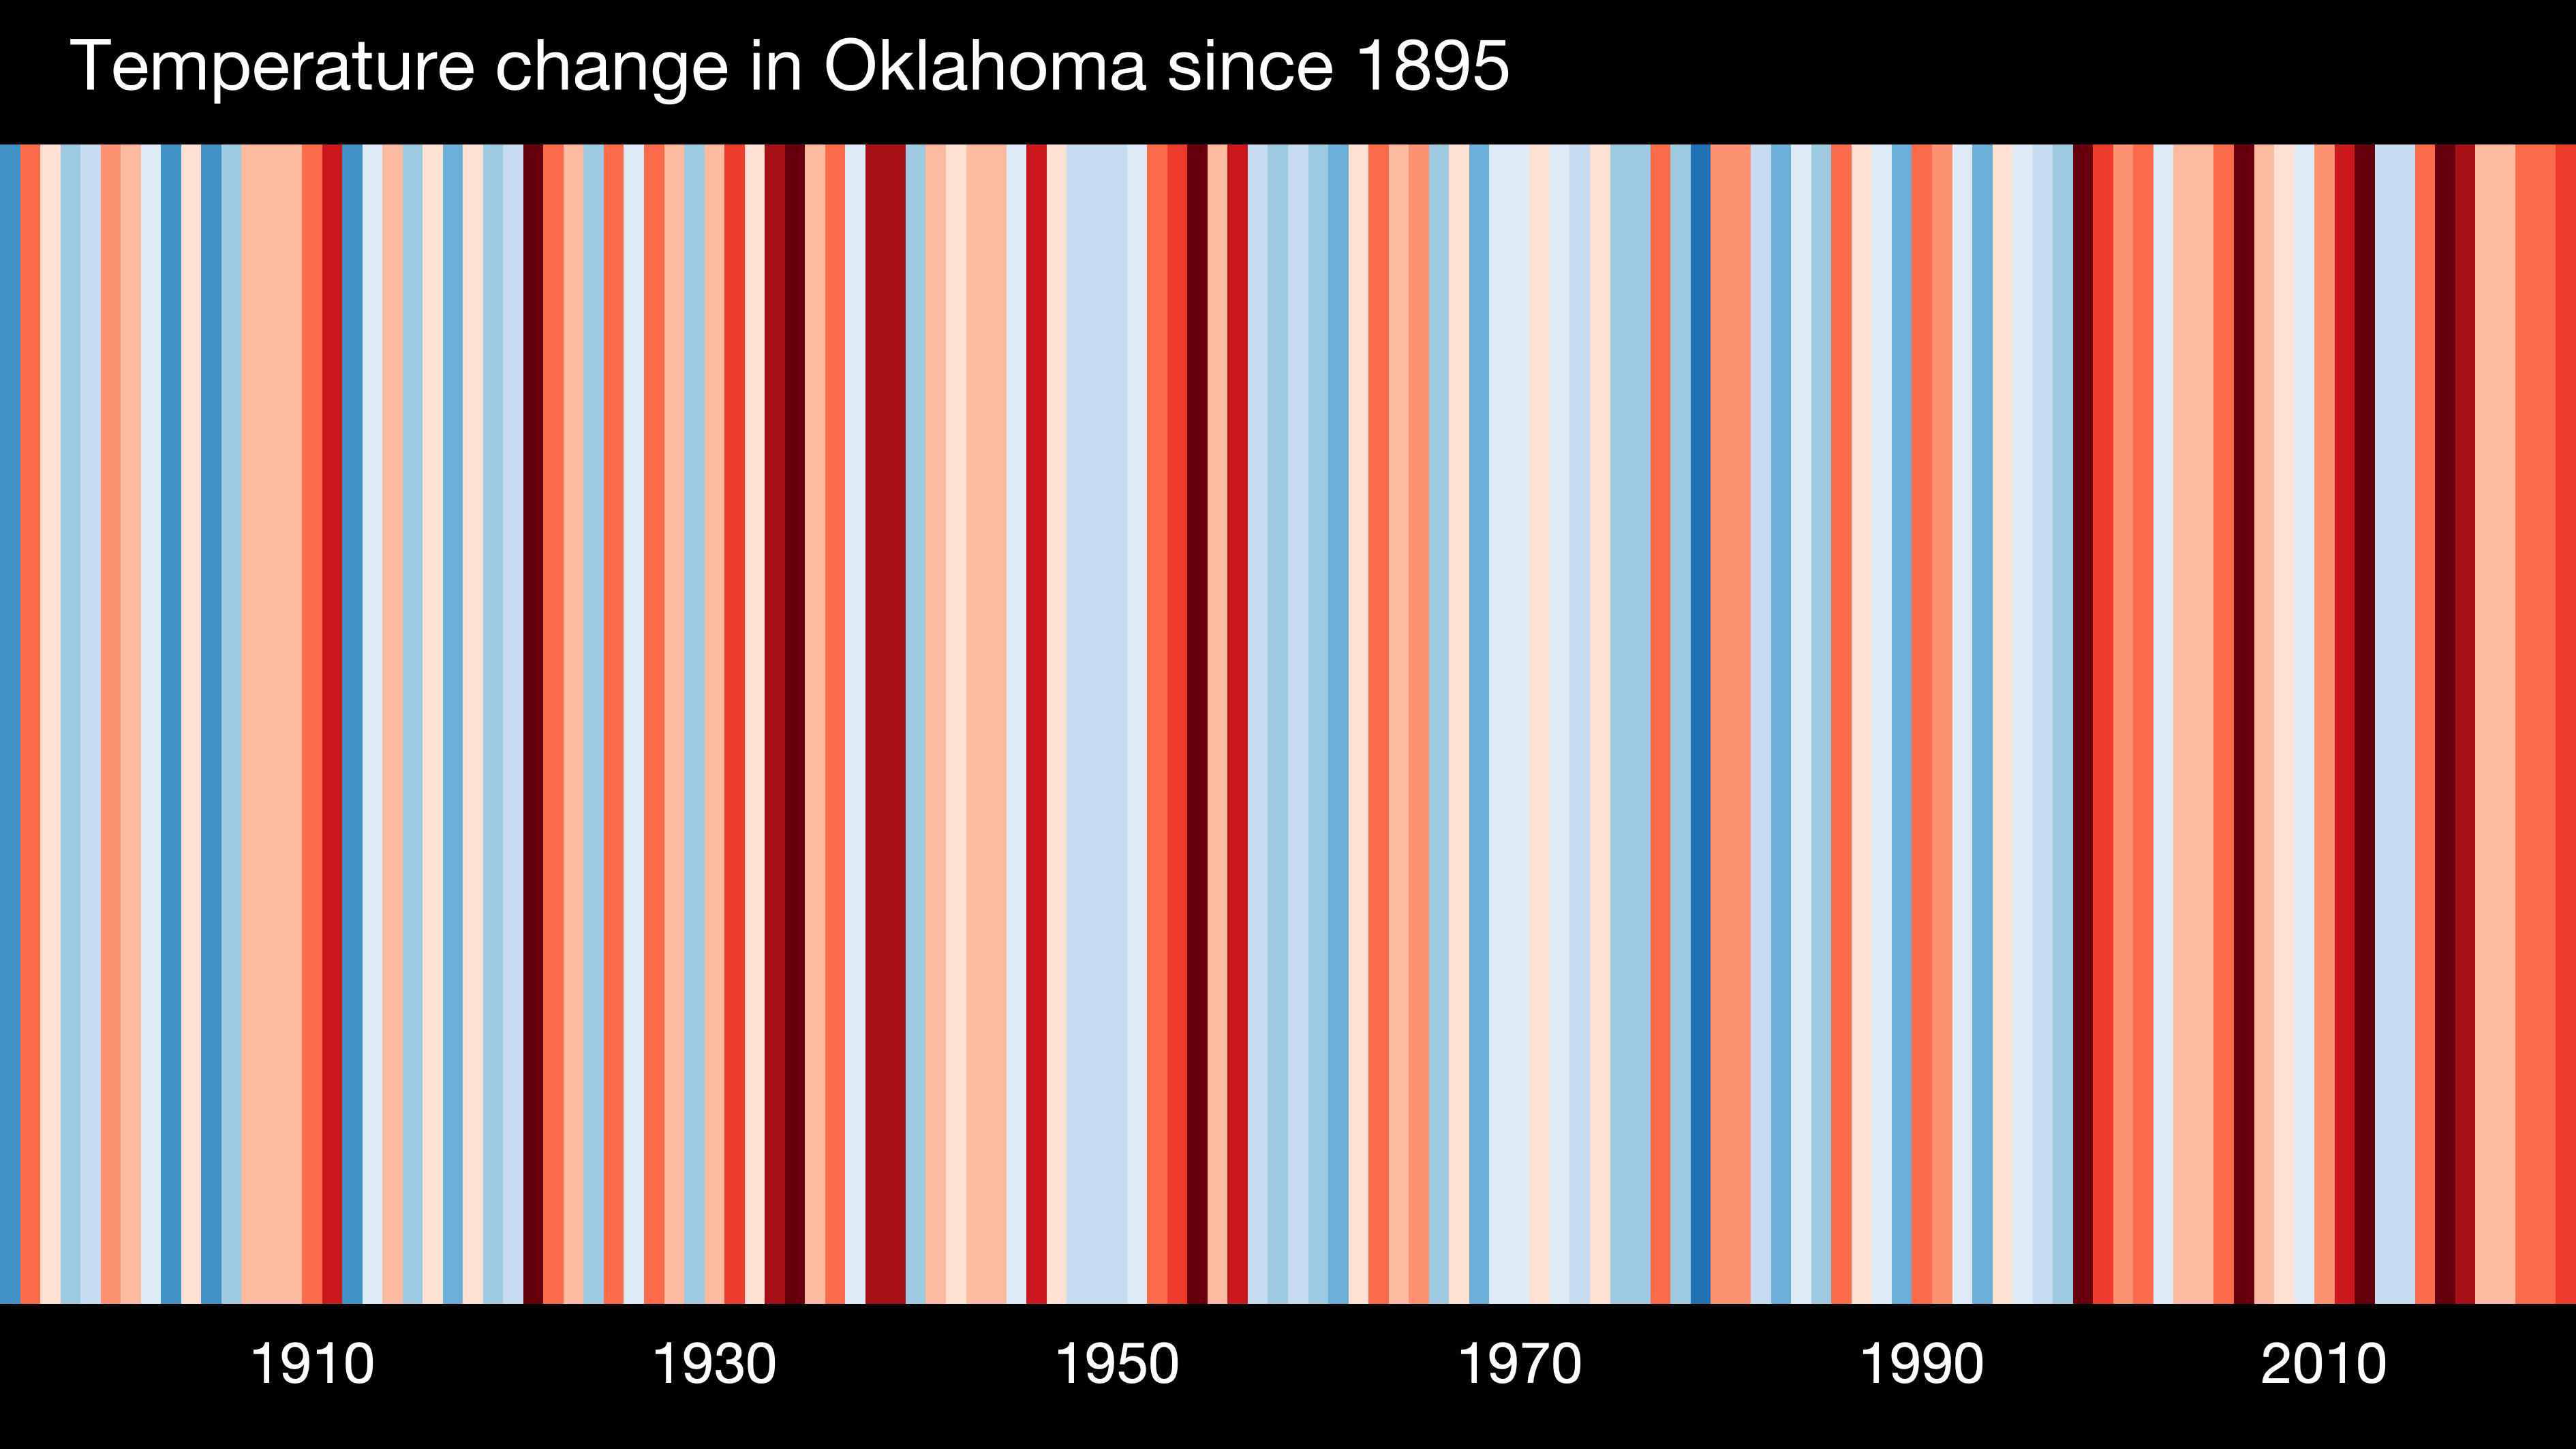
I find this kind of thing fascinating. Go check it out for your continent, country, state or province at ShowYourStripes.Info. Let me know what you find.
Linking with Skywatch Friday